K8s-10: Monitoring
监控
监控指标
集群层面
节点资源利用率: CPU、内存、磁盘、网络
节点数
pod 数
Pod 层面
容器资源利用率
应用指标
Prometheus
开源的监控系统,由 SoundCloud 开发,于 2016 年加入 CNCF,使用 Go 语言开发。
优点
多维度数据模型
灵活的查询语言
不依赖分布式存储
通过 pull 模式采集时间序列数据
支持多种图形和仪表盘
Grafana
开源的数据可视化工具,支持多种数据源,如 Prometheus、ElasticSearch、InfluxDB、MySQL、PostgreSQL 等。
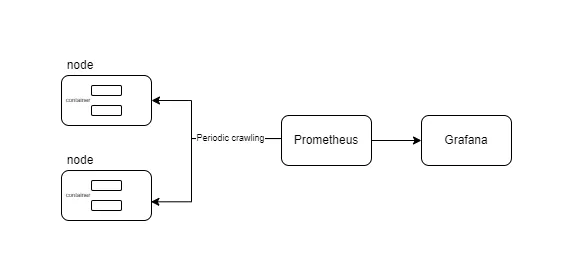
监控架构
部署步骤
部署 node-exporter
部署 kube-state-metrics
部署 prometheus
部署 grafana